

Did you know public pensions are in a much stronger position than just a decade ago? In 2018, 45 states had pension obligations above their historical sustainability benchmarks. By 2024, that number had fallen to two.
That is a significant change in six years, and one that often gets overlooked in debates dominated by unfunded liabilities. The latest state-by-state analysis from the National Conference on Public Employee Retirement Systems (NCPERS) offers a broader view of pension finances by comparing those obligations with the economic capacity behind them.
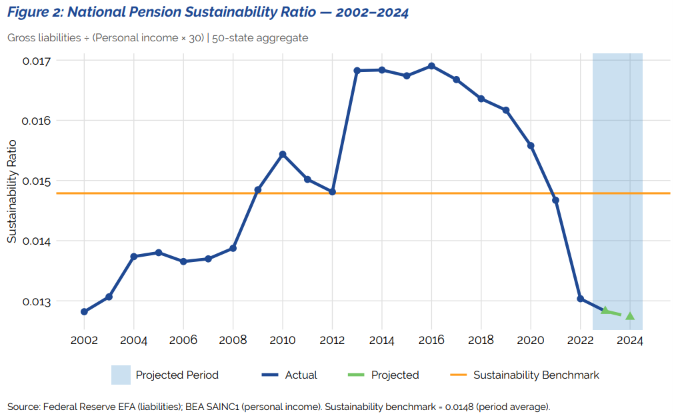
Across 48 states, pension liabilities relative to personal income are now at or below their own long-term averages. Nationally, that ratio has remained below its historical average for four consecutive years, through 2024. By this measure, public pensions are in their strongest overall position in more than two decades.
What The Numbers Measure
Much of the discussion about public pensions centers on the funded ratio: the share of a plan’s promised benefits covered by the assets it has set aside. That figure helps track a plan’s funding progress, but it does not capture the much broader economic resources available to support pension contributions over time.
The NCPERS Sustainability report adds needed context to the pension financing discussion. It compares pension liabilities with the full economic base that pays state and local taxes. Additionally, in this calculation, annual personal income is multiplied by 30 to match the framework’s 30-year horizon for pension obligations. Traditional funded ratios measure the full obligation as if it had to be paid out all at once, which is never the case. The. This analysis then compares each state’s ratio with its own average over 2002–2024.
A ratio above that average indicates greater fiscal pressure relative to the state’s history. A ratio below it indicates a smaller burden relative to its own economic capacity. These are state-specific benchmarks, so the results describe how each state compares with its own past rather than ranking all states against a single standard.
Consider a state where pension liabilities increase while residents’ income grows faster. The state still has obligations to meet, but those obligations represent a smaller share of its economic capacity. Looking only at the dollar amount owed would miss that improvement.
Progress Across The States
The state figures show how widely the picture has changed. Vermont and North Dakota are the only states still above their historical benchmarks as of 2024, both by small margins.
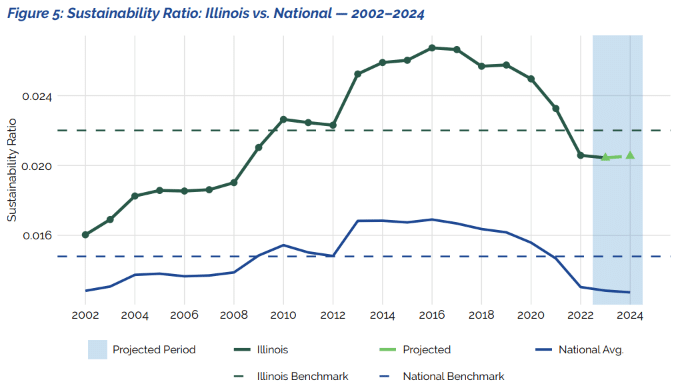
Illinois, which has faced persistent pension funding challenges, moved below its historical sustainability benchmark in 2022 after 12 consecutive years above it. Its ratio fell from 0.0267 at its 2016 peak to 0.0206 in 2022, below its 0.0220 benchmark. The projected figures show it remaining below that level through 2024. Rhode Island, Ohio, Colorado, Alaska, and Utah showed the largest improvements since 2018, measured by how far below their respective benchmarks they were.
The national improvement reflects strong personal income growth between 2019 and 2022, alongside a significant decline in measured pension liabilities in 2022. In addition, many states have shored up their pension funds in recent years with millions in supplemental payments. These changes reduced pension obligations relative to the economic base supporting them.
What Comes Next
A stronger sustainability position in this measure does not mean every pension plan is fully funded or that states can reduce their contributions. It means pension obligations have become more manageable relative to the economic resources supporting them. Funding gaps still need to be addressed, but a gap alone does not establish that a pension system is unsustainable.
The shift from 45 states above their benchmarks to now just two shows how far states have come in securing retirement benefits for millions of public employees. Now they have an opportunity to build on that progress by faithfully making their required contributions and protecting earned benefits. For public employees and retirees who count on pension income after years of service, responsible funding is how states keep their retirement promises. This metric helps gauge the fund’s financial well-being without amplifying the doom and gloom pension opponents insist on spreading.
For a closer look at the national trends and where your state stands, read the full report, Measuring the Fiscal Sustainability of Public Pensions.